elections.shape(182, 6)Most everyday mathematics consists of manipulating numbers one at a time. Formally, we call these values scalars.
For example, the temperature in Greenville is a balmy \(72\) degrees Fahrenheit. If you wanted to convert the temperature to Celsius you would evaluate the expression \(c = \frac{5}{9}(f - 32)\), setting \(f = 72\). In this equation, the values \(5\), \(9\), and \(32\) are constant scalars. The variables \(c\) and \(f\) in general represent unknown scalars.
We denote scalars by ordinary lower-cased letters (e.g. \(x\), \(y\), and \(z\)) and the space of all (continuous) real-valued scalars by \(\mathbb{R}\). The expression \(x \in \mathbb{R}\) is a formal way to say that \(x\) is a real-valued scalar. The symbol \(\in\) (pronounced “in”) denotes membership in a set. For example, \(x, y \in {0, 1}\) indicates that \(x\) and \(y\) are variables that can only take on values of \(0\) or \(1\).
Scalars in Python are represented by numeric types such as int and float.
x = 3
y = 2

print("x+y:", x+y, "x-y:", x-y, "x*y:", x*y, "x/y:", x/y, "x**y:", x**y)Dimensionality, in the context of data, refers to the number of axes or directions in which data can be represented. The most common dimensions are 0, 1, 2, and n.
Scalars (0-dimensional data; values) are single numbers. They can be integers, real numbers, or complex numbers. Scalars are the simplest objects in linear algebra. In Python, we can represent scalars using the built-in int and float data types. For example, 3 and 3.0 are both scalars.
Vectors (1-dimensional data, collection of values) are one-dimensional arrays of scalars. They are used to represent quantities that have both magnitude and direction. In native Python, we can represent vectors using lists or tuples. For example, [1, 2, 3] is a vector.
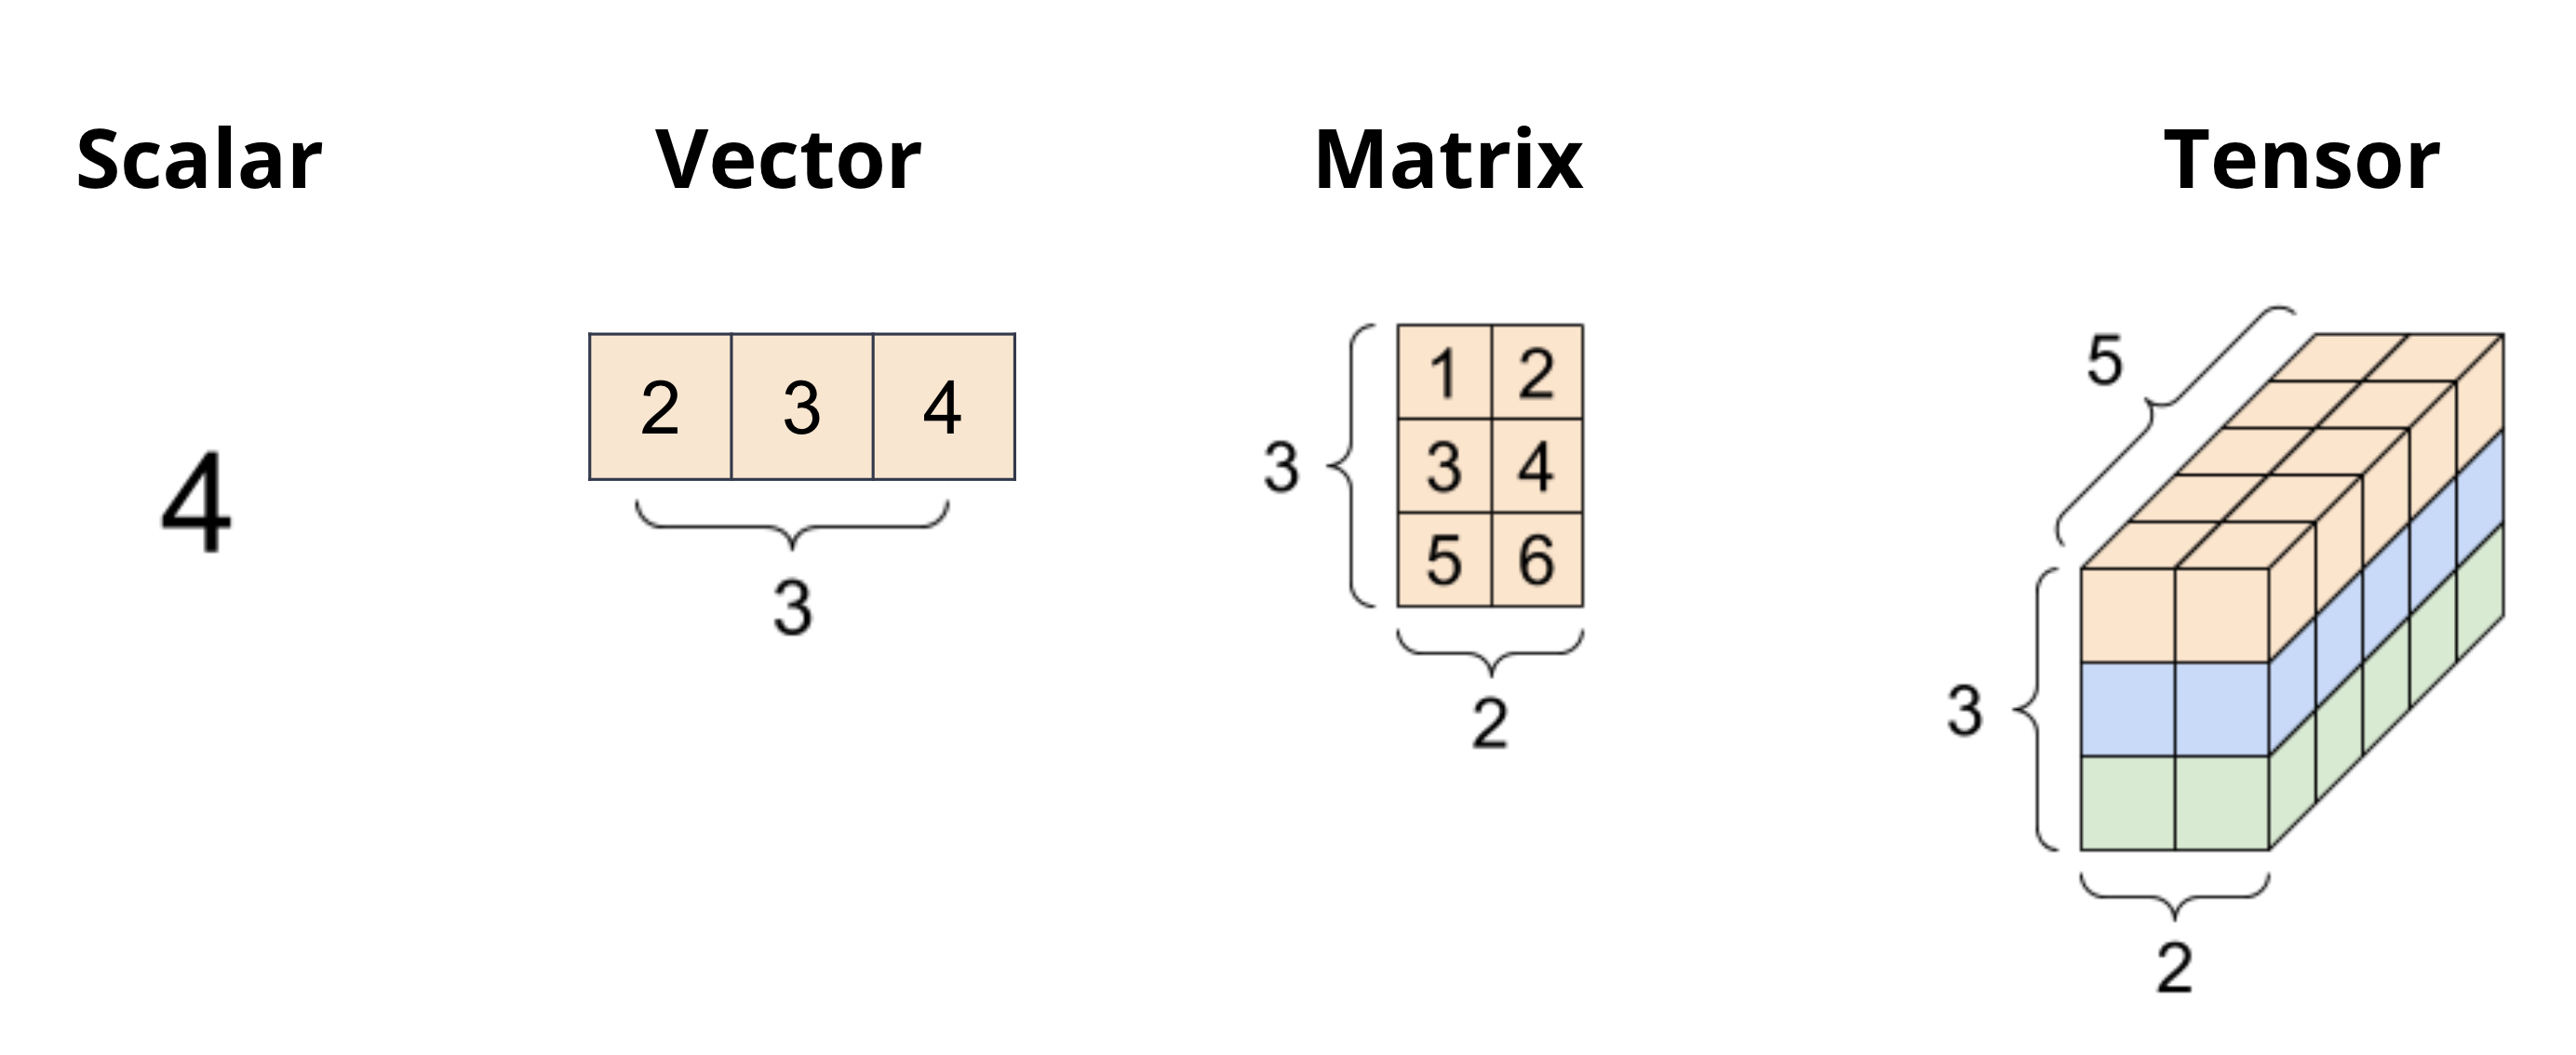
Matrices (2-dimensional data, collection of vectors) are two-dimensional arrays of scalars. They are used to represent linear transformations from one vector space to another. In native Python, we can represent matrices using lists of lists. For example, [[1, 2], [3, 4]] is a matrix.
Tensors (n-dimensional data, collection of matrices) are n-dimensional arrays of scalars. They are used to represent multi-dimensional data.
Tables are one of the most common ways to organize data. This is in large part due to the simplicity and flexibility of tables. Tables allow us to represent each observation, or instance of collecting data from an individual, as its own row. We can record distinct characteristics, or features, of each observation in separate columns.

To see this in action, we’ll explore the elections dataset, which stores information about political candidates who ran for president of the United States in various years.
The first few rows of elections dataset in CSV format are as follows:
Year,Candidate,Party,Popular vote,Result,%\n
1824,Andrew Jackson,Democratic-Republican,151271,loss,57.21012204\n
1824,John Quincy Adams,Democratic-Republican,113142,win,42.78987796\n
1828,Andrew Jackson,Democratic,642806,win,56.20392707\n
1828,John Quincy Adams,National Republican,500897,loss,43.79607293\n
1832,Andrew Jackson,Democratic,702735,win,54.57478905\n
This dataset is stored in Comma Separated Values (CSV) format. CSV files due to their simplicity and readability are one of the most common ways to store tabular data. Each line in a CSV file (file extension: .csv) represents a row in the table. In other words, each row is separated by a newline character \n. Within each row, each column is separated by a comma ,, hence the name Comma Separated Values.
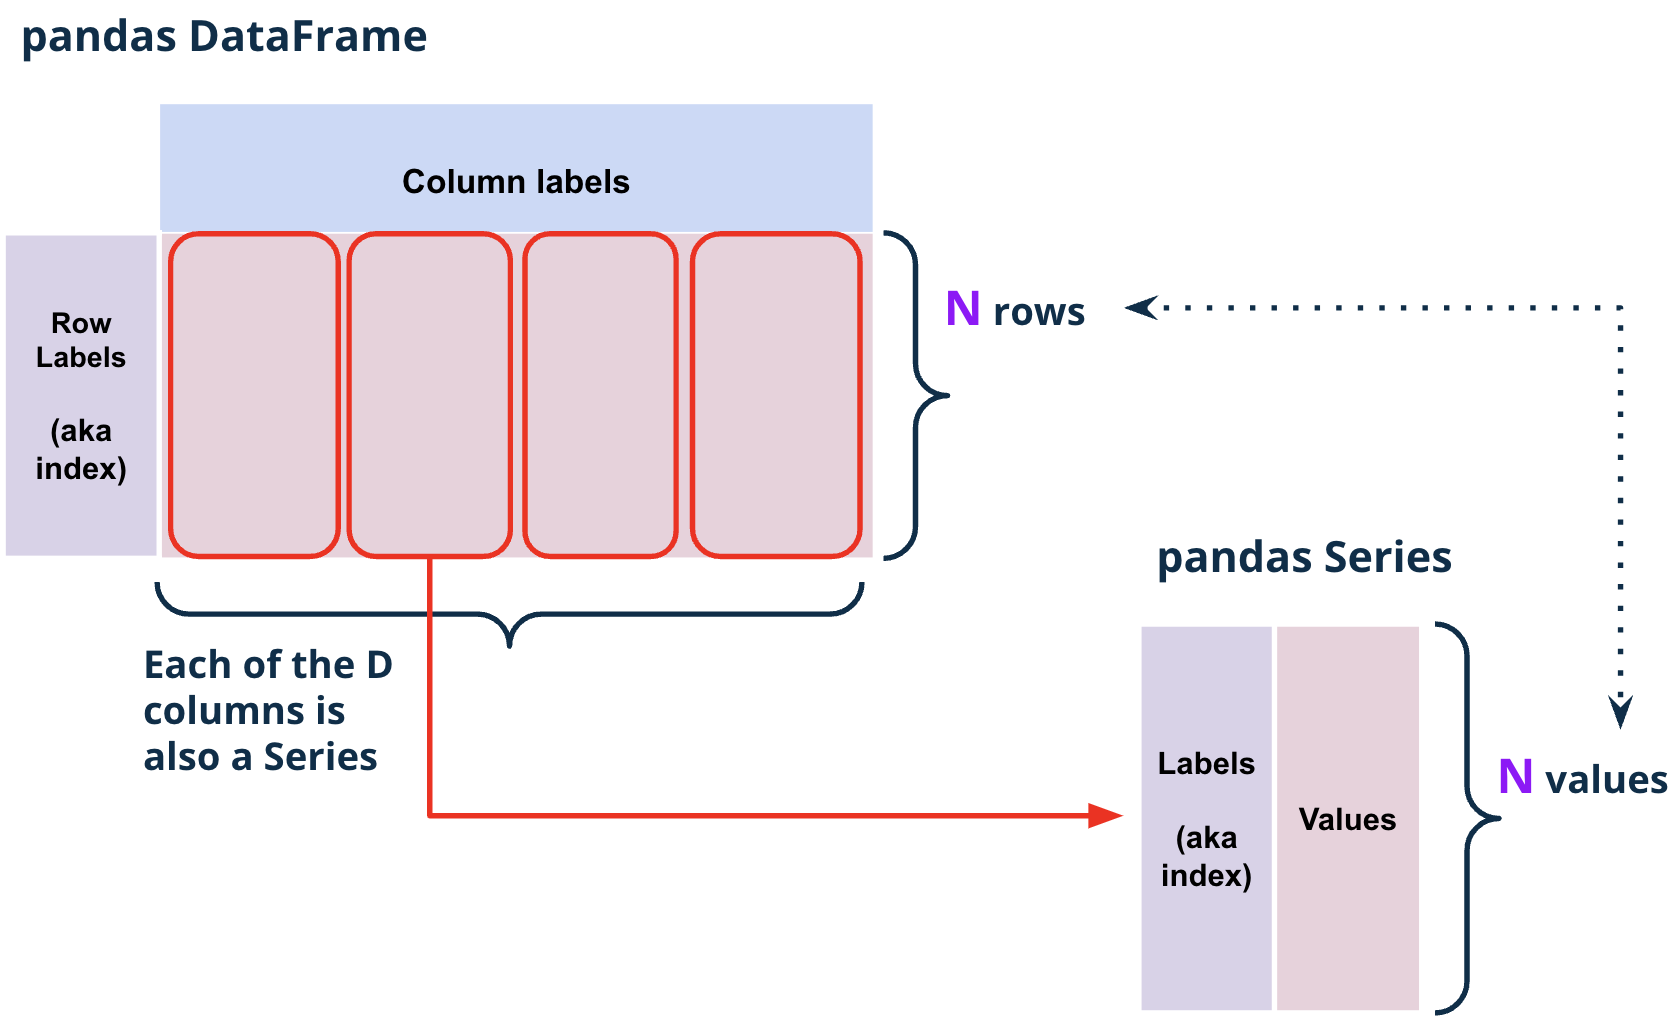
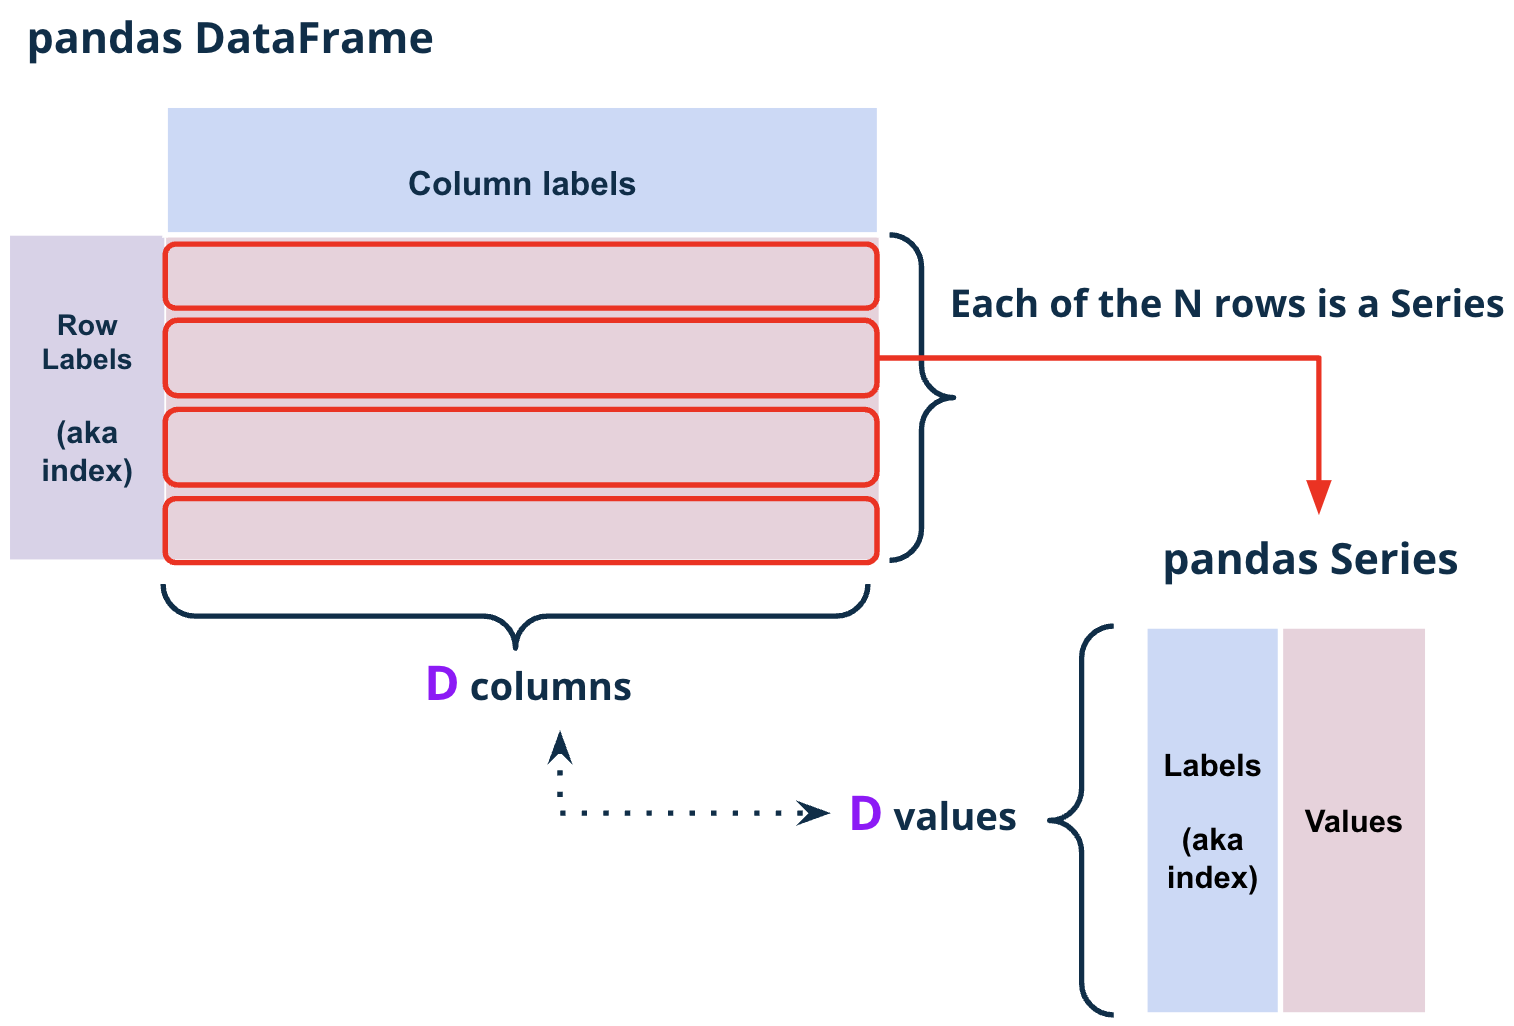
There are three fundamental data structures in pandas:
DataFrames, Series, and Indices can be represented visually in the following diagram, which considers the first few rows of the elections dataset.
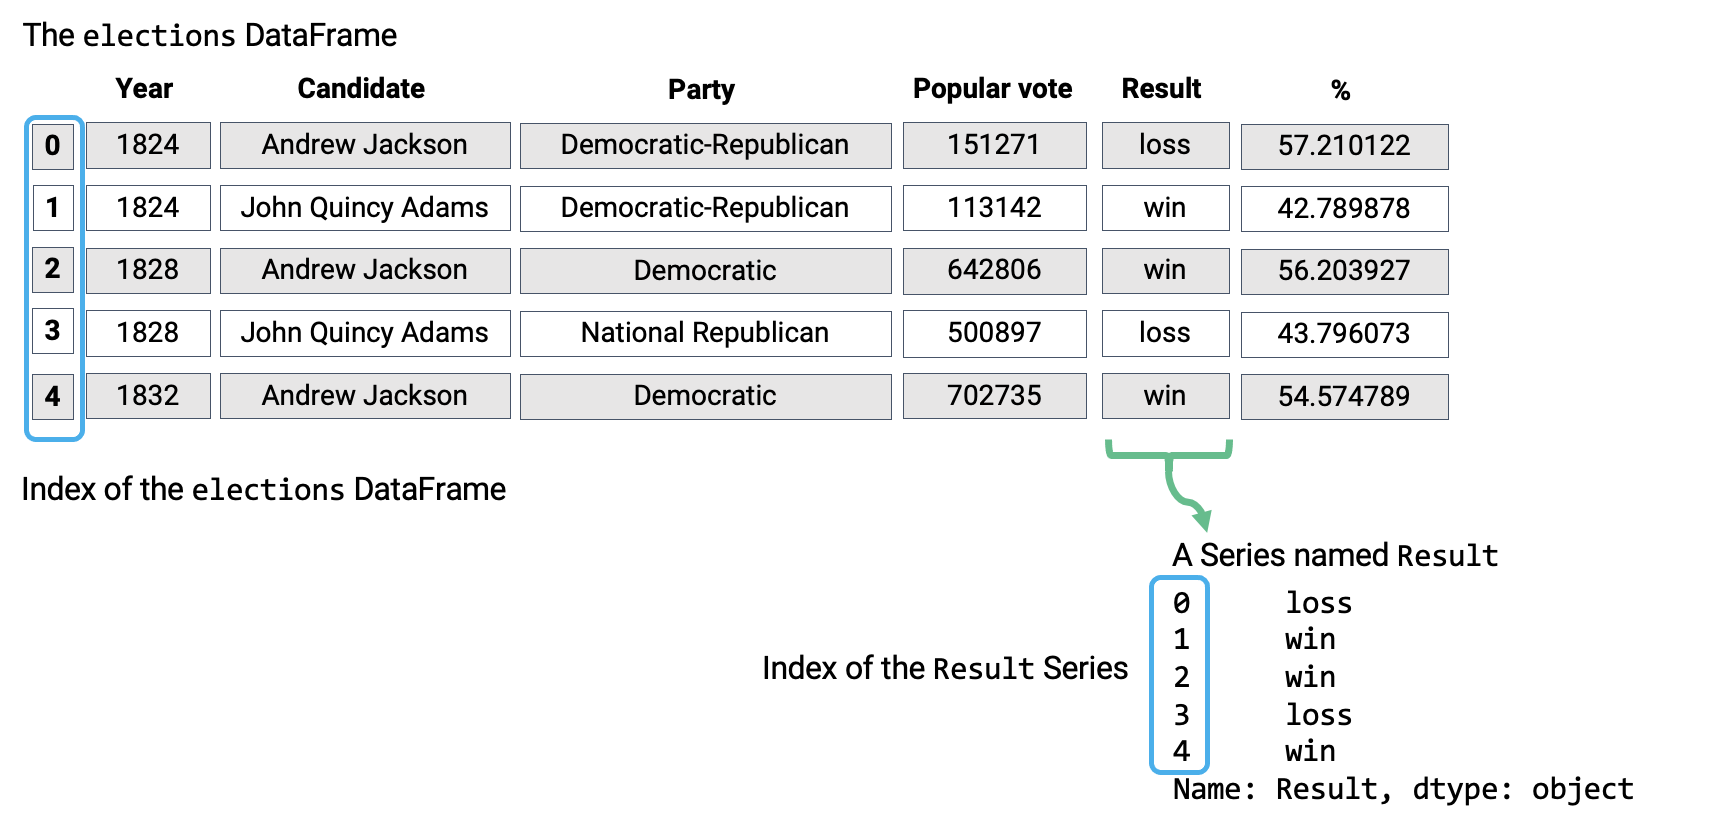
Notice how the DataFrame is a two-dimensional object – it contains both rows and columns. The Series above is a singular column of this DataFrame, namely, the Result column. Both contain an Index, or a shared list of row labels (here, the integers from 0 to 4, inclusive).

.shape attribute.shape is an attribute of a DataFrame that returns a tuple representing the dimensions of the DataFrame.
elections.shape(182, 6)The first element of the tuple is the number of rows, and the second element is the number of columns.