Course Project
In this course, you are expected to plan, execute, and present the results of a semester-long group project of your choosing.
Take the time to investigate multiple options during the proposal phase. You should have gotten some preliminary results by then, enough to provide confidence you will be able to successfully complete the project.
Groups
Working alone on the project is strongly discouraged. Group sizes should range from two to three students. It is possible for multiple groups working on the same data set. However, such groups must work independently and are not allowed to share code or results. Each dataset leaves enough room to pursue different directions so I expect to see variety among the submissions from each group.
Data Science Lifecycle
The steps of your project are to mirror the general data science lifecycle pipeline.
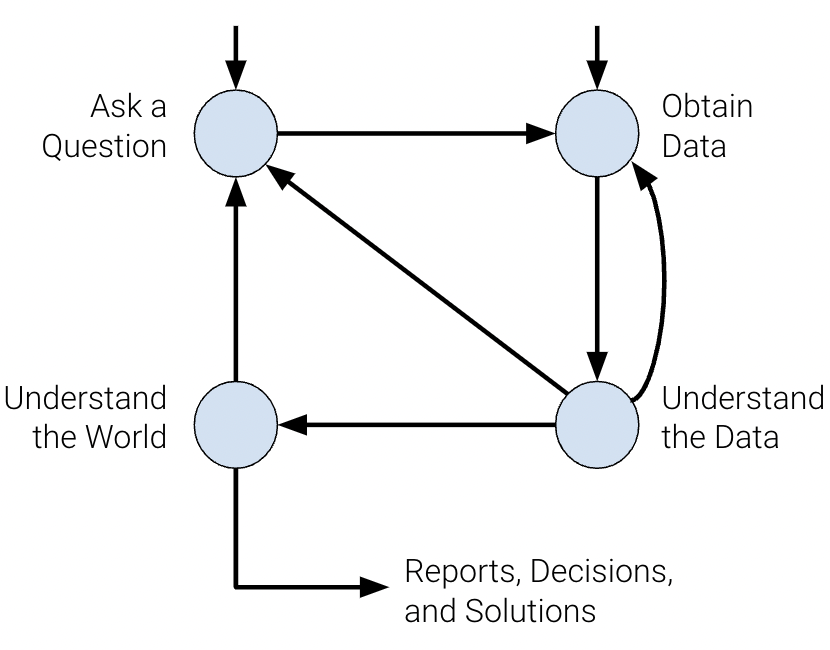
The data science lifecycle is a high-level overview of the data science workflow. It’s a cycle of stages that a data scientist should explore as they conduct a thorough analysis of a data-driven problem.
There are many variations of the key ideas present in the data science lifecycle. Here, we visualize the stages of the lifecycle using a flow diagram.

1. Ask a Question and Obtain Data
Whether by curiosity or necessity, data scientists will constantly ask questions. For example, in the business world, data scientists may be interested in predicting the profit generated by a certain investment. In the field of medicine, they may ask whether some patients are more likely than others to benefit from a treatment.
Posing questions is one of the primary ways the data science lifecycle begins. It helps to fully define the question. Here are some things you should ask yourself before framing a question.
- What do we want to know?
- A question that is too ambiguous may lead to confusion.
- What problems are we trying to solve?
- The goal of asking a question should be clear in order to justify your efforts to stakeholders.
- What are the hypotheses we want to test?
- This gives a clear perspective from which to analyze final results.
- What are the metrics for our success?
- This gives a clear point to know when to finish the project.
 |
 |
| 1. Ask a Question | 2. Obtain Data |
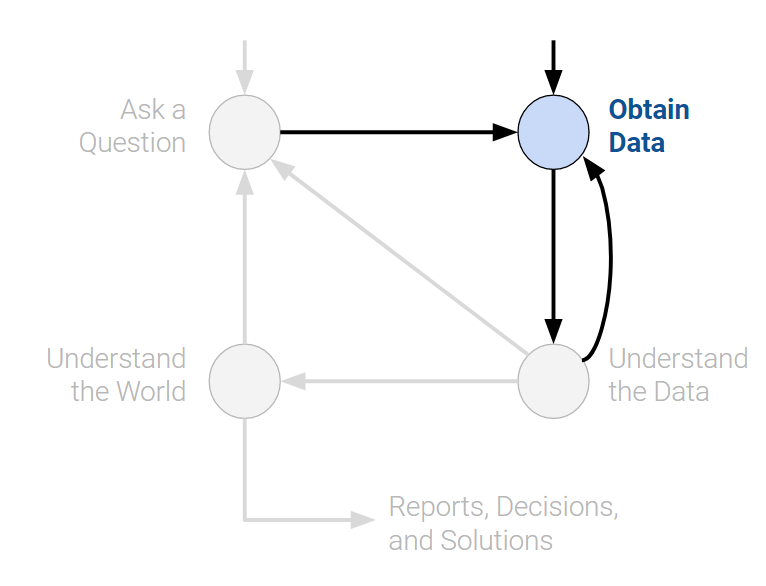
The second entry point to the lifecycle is by obtaining data. A careful analysis of any problem requires the use of data. Data may be readily available to us, or we may have to embark on a process to collect it. When doing so, its crucial to ask the following:
- What data do we have and what data do we need?
- Define the units of the data (people, cities, points in time, etc.) and what features to measure.
- How will we sample more data?
- Scrape the web, collect manually, etc.
- Is our data representative of the population we want to study?
- If our data is not representative of our population of interest, then we can come to incorrect conclusions.
Identify or collect a publicly available data set that you will use for your project. A list of possible datasets and project ideas are provided here but you are allowed to propose your own project and data set. Just be mindful of the scale of the data: it should be large enough to be appropriate for usage in Machine Learning, but not so large that it is unwieldy.
Key procedures: Data Acquisition, Data Cleaning
2. Understand the Data
Raw data itself is not inherently useful. It’s impossible to discern all the patterns and relationships between variables without carefully investigating them. Therefore, translating pure data to actionable insights is a key job of a data scientist. For example, we may choose to ask:
- How is our data organized and what does it contain?
- Knowing what the data says about the world helps us better understand the world.
- Do we have relevant data?
- If the data we have collected is not useful to the question at hand, then we must collected more data.
- What are the biases, anomalies, or other issues with the data?
- These can lead to many false conclusions if ignored, so data scientists must always be aware of these issues.
- How do we transform the data to enable effective analysis?
- Data is not always easy to interpret at first glance, so a data scientist should reveal these hidden insights.
Perform some exploratory analysis to help you get acquainted with the data. This may include data visualization and basic preliminary analysis. Identify interesting aspects of the data set that would be useful for downstream prediction: correlations, outliers, missing values, etc.
Key procedures: Exploratory data analysis, Data visualization.
3. Understand the World
After observing the patterns in our data, we can begin answering our question. This may require that we predict a quantity (machine learning), or measure the effect of some treatment (inference).
From here, we may choose to report our results, or possibly conduct more analysis. We may not be satisfied by our findings, or our initial exploration may have brought up new questions that require a new data.
- What does the data say about the world?
- Given our models, the data will lead us to certain conclusions about the real world.
- Given our models, the data will lead us to certain conclusions about the real world.
- Does it answer our questions or accurately solve the problem?
- If our model and data can not accomplish our goals, then we must reform our question, model, or both.
- If our model and data can not accomplish our goals, then we must reform our question, model, or both.
- How robust are our conclusions and can we trust the predictions?
- Inaccurate models can lead to untrue conclusions.
Preprocess data to change raw feature vectors into a representation that is more suitable for the downstream analysis. This may include data cleaning, calculating derivative or second-order variables, feature extraction, and feature selection.
Implement baseline models covered in class and report their performance.
Identify, implement and apply as many models as relevant from class to predict some aspect of the data. This must be a supervised learning model. This may include, model selection, and model evaluation.
You must compare your results to a number of baselines, including random predictor, major class classifier and/or autocorrelation model. An example table is shown below:
| Model | Accuracy | Precision | Recall | F1-score |
|---|---|---|---|---|
| Random baseline | 0.5 | 0.52 | 0.55 | 0.53 |
| Majority class / Autocorrelation | 0.75 | 0.5 | 1 | 0.66 |
| Model 1 | 0.77 | 0.72 | 0.74 | 0.73 |
| Model 2 | 0.85 | 0.79 | 0.89 | 0.88 |
Discuss the results of your analysis. This must include stating the assumptions of the model, the limitations of the model, a thorough error analysis and future directions.
Key procedures: Model Creation, Prediction, Inference, Model Selection, Error Analysis.