Unsupervised learning
Taxonomy of unsupervised learning models
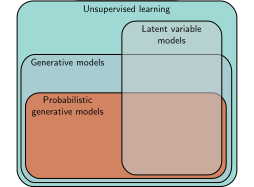
Taxonomy of unsupervised learning models. Unsupervised learning refers to any model trained on datasets without labels. Generative models can synthesize (generate) new examples with similar statistics to the training data. A subset of these are probabilistic and define a distribution over the data. We draw samples from this distribution to generate new examples. Latent variable models define a mapping between an underlying explanatory (latent) variable and the data and may fall into any of the above categories.
\[\begin{eqnarray} L[\boldsymbol\phi] = -\sum_{i=1}^{I}\log\Bigl[Pr(\mathbf{x}_{i}|\boldsymbol\phi)\Bigr]. \end{eqnarray}\]
What makes a good generative model?
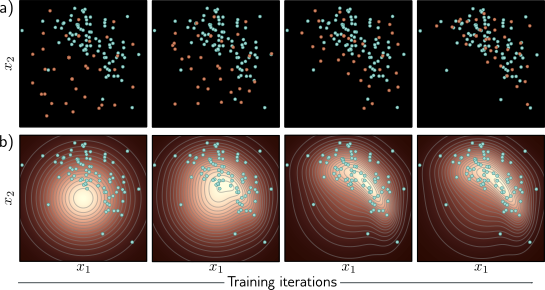
Fitting generative models a) Generative adversarial models provide a mechanism for generating samples (orange points). As training proceeds (left to right), the loss function encourages these samples to become progressively less distinguishable from real examples (cyan points). b) Probabilistic models (including variational autoencoders, normalizing flows, and diffusion models) learn a probability distribution over the training data. As training proceeds (left to right), the likelihood of the real examples increases under this distribution, which can be used to draw new samples and assess the probability of new data points.
Quantifying performance
Test Likelihood
Inception Score
\[\begin{eqnarray} IS &=& \exp\left[\frac{1}{I}\sum_{i=1}^{I}D_{KL}\Bigl[Pr(y|\mathbf{x}^*_{i})||Pr(y) \Bigr]\right], \end{eqnarray}\]
\[\begin{eqnarray} Pr(y) = \frac{1}{I}\sum_{i=1}^I Pr(y|\mathbf{x}^*_i). \end{eqnarray}\]
Frechet Inception Distance
Manifold Precision and Recall
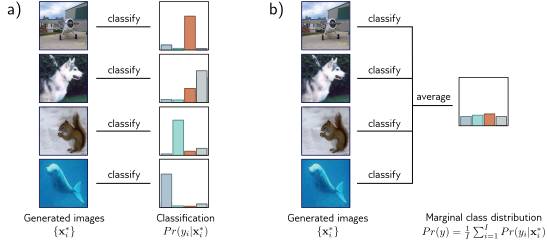
Inception score. a) A pretrained network classifies the generated images. If the images are realistic, the resulting class probabilities Pr(y|x ∗ i ) should be peaked at the correct class. b) If the model generates all classes equally frequently, the marginal (average) class probabilities should be flat. The inception score measures the average distance between the distributions in (a) and the distribution in (b). Images from Deng et al. (2009).
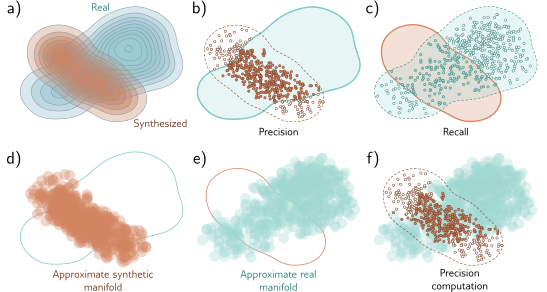
Manifold precision/recall. a) True distributions of real examples and samples synthesized by the generative model. b) The overlap can be summarized by the precision (the proportion of synthesized samples that overlap with the distribution or manifold of real examples), and c) recall (the proportion of real examples that overlap with the manifold of the synthesized samples). d) The manifold of synthesized samples can be approximated by taking the union of a set of hyperspheres centered on each sample. Here, these have constant radius, but more commonly, the radius is based on the distance to the kth nearest neighbor. e) The manifold for real examples is approximated similarly. f) The precision can be computed as the proportion of samples that lie within the approximated manifold of real examples. Similarly, the recall is computed as the proportion of real examples that lie within the approximated manifold of samples (not shown). Adapted from Kynkäänniemi et al. (2019).