11. Graphical Models#
Specifying a joint distribution over even a handful of random variables can become very daunting very fast. When we consider the fact that a typical medical- diagnosis problem has dozens or even hundreds of relevant attributes, the problem appears completely intractable.
Probabilistic graphical models, also known as Bayesian networks, provide a framework for exploiting structure in complex distributions so they can be described compactly, and in a way that allows them to be constructed and utilized effectively.
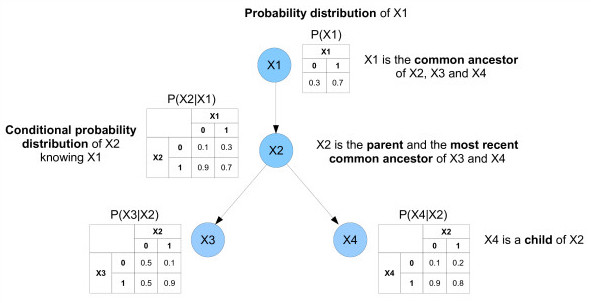
Probabilistic graphical models use a graph-based representation as the basis for compactly encoding a complex distribution over a high-dimensional space. In this graphical representation, the nodes (or ovals) correspond to the variables in our domain, and the edges correspond to direct probabilistic dependencies between the connected variables.
Popular examples of probabilistic graphical models include Naive Bayes, Markov Chains and Hidden Markov Models.