2.1. Feature Types#
Tabular data (pd.DataFrame), as discussed previously, is made up of observations (rows) and features (columns). Data type (df.dtypes) of features fall into two primary categories: numeric and categorical.
There also exists a third special category of data type called missing. Missing data is a special data type because it is not a data type at all. It is a placeholder for a value that is not known or not applicable. Missing data is represented by NaN (not a number) in pandas. More on missing data in a bit.
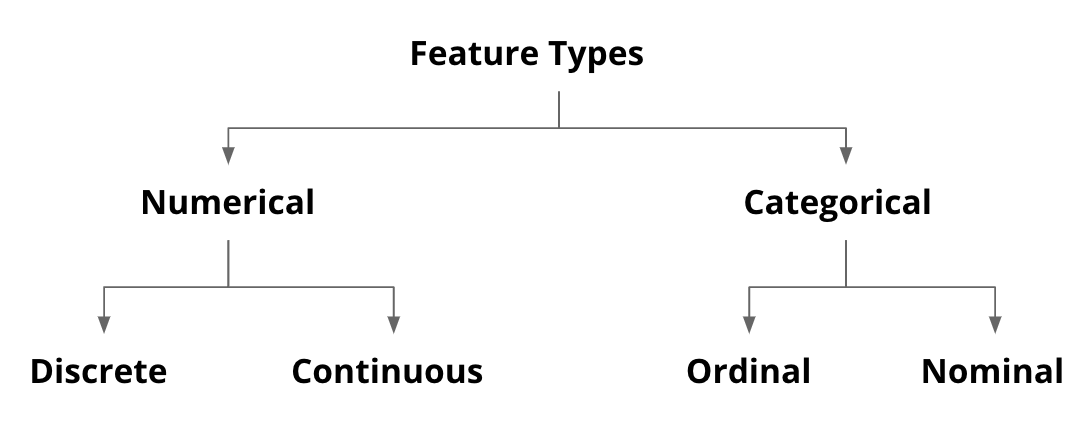
Fig. 2.2 Classification of feature types#
To study these feature types, we will use the dataset of food safety scores for restaurants in San Francisco. The scores and violation information have been made available by the San Francisco Department of Public Health.
import pandas as pd

data = pd.read_csv('https://raw.githubusercontent.com/fahadsultan/csc272/main/data/restaurants_truncated.csv', index_col=0)
data.head()
| id | zip | phone | lat | lng | type | score | risk | violation | |
|---|---|---|---|---|---|---|---|---|---|
| 0 | 70064 | 94103.0 | 1.415565e+10 | NaN | NaN | Routine - Unscheduled | 75.0 | High Risk | Improper reheating of food |
| 1 | 90039 | 94103.0 | NaN | NaN | NaN | Routine - Unscheduled | 81.0 | High Risk | High risk food holding temperature |
| 2 | 89059 | 94115.0 | 1.415369e+10 | NaN | NaN | Complaint | NaN | NaN | NaN |
| 3 | 91044 | 94112.0 | NaN | NaN | NaN | Routine - Unscheduled | 84.0 | Moderate Risk | Inadequate and inaccessible handwashing facili... |
| 4 | 62768 | 94122.0 | NaN | 37.765421 | -122.477256 | Routine - Unscheduled | 90.0 | Low Risk | Food safety certificate or food handler card n... |
2.1.1. Missing Data#
Missing data occurs commonly in many data analysis applications. One of the goals of pandas is to make working with missing data as painless as possible. For example, all of the descriptive statistics on pandas objects exclude missing data by default.
The way that missing data is represented in pandas objects is somewhat imperfect, but it is sufficient for most real-world use. For data with float64 dtype, pandas uses the floating-point value NaN (Not a Number) to represent missing data.
We call this a sentinel value: when present, it indicates a missing (or null) value.
The isna method gives us a Boolean Series with True where values are null:
data.isna().sum()
id            0
zip           1
phone        27
lat          30
lng          30
type          0
score        15
risk         17
violation    17
dtype: int64
In pandas, missing data is also refered to as NA, which stands for Not Available. In statistics applications, NA data may either be data that does not exist or that exists but was not observed (through problems with data collection, for example). When cleaning up data for analysis, it is often important to do analysis on the missing data itself to identify data collection problems or potential biases in the data caused by missing data.
The built-in Python None value is also treated as NA.
Method |
Description |
|---|---|
|
Filter axis labels based on whether values for each label have missing data, with varying thresholds for how much missing data to tolerate. |
|
Fill in missing data with some value |
|
Return Boolean values indicating which values are missing/NA. |
|
Negation of |
2.1.2. Numerical Features#
Numeric data is data that can be represented as numbers. These variables generally describe some numeric quantity or amount and are also sometimes referred to as “quantitative” variables.
Since numerical features are already represented as numbers, they are already ready to be used in machine learning models and there is no need to encode them.
In the example above, numerical features include zip, phone, lat, lng, score.
Show code cell source
data[['zip', 'phone', 'lat', 'lng', 'score']].head()
| zip | phone | lat | lng | score | |
|---|---|---|---|---|---|
| 0 | 94105 | NaN | 37.787925 | -122.400953 | 82.0 |
| 1 | 94109 | NaN | 37.786108 | -122.425764 | NaN |
| 2 | 94115 | NaN | 37.791607 | -122.434563 | 82.0 |
| 3 | 94115 | NaN | 37.788932 | -122.433895 | 78.0 |
| 4 | 94110 | NaN | 37.739161 | -122.416967 | 94.0 |
2.1.2.1. Discrete Features#
Discrete data is data that is counted. For example, the number of students in a class is discrete data. You can count the number of students in a class. You can not count the number of students in a class and get a fraction of a student. You can only count whole students.
In the restaurants inspection data set, zip, phone, score are discrete features.
Show code cell source
data[['zip', 'phone', 'score']].head()
| zip | phone | score | |
|---|---|---|---|
| 0 | 94105 | NaN | 82.0 |
| 1 | 94109 | NaN | NaN |
| 2 | 94115 | NaN | 82.0 |
| 3 | 94115 | NaN | 78.0 |
| 4 | 94110 | NaN | 94.0 |
2.1.2.2. Continuous Features#
Continuous data is data that is measured. For example, the height of a student is continuous data. You can measure the height of a student. You can measure the height of a student and get a fraction of a student. You can measure a student and get a height of 5 feet and 6.5 inches.
In the restaurants inspection data set, lat, lng are continuous features.
Show code cell source
data[['lat', 'lng']].head()
| lat | lng | |
|---|---|---|
| 0 | 37.787925 | -122.400953 |
| 1 | 37.786108 | -122.425764 |
| 2 | 37.791607 | -122.434563 |
| 3 | 37.788932 | -122.433895 |
| 4 | 37.739161 | -122.416967 |
2.1.3. Categorical Features#
Categorical data is data that is not numeric. It is often represented as text or a set of text values. These variables generally describe some characteristic or quality of a data unit, and are also sometimes referred to as “qualitative” variables.
Show code cell source
data[['type', 'risk', 'violation']].head()
| type | risk | violation | |
|---|---|---|---|
| 0 | Routine - Unscheduled | High Risk | High risk food holding temperature |
| 1 | Complaint | NaN | NaN |
| 2 | Routine - Unscheduled | Low Risk | Inadequate warewashing facilities or equipment |
| 3 | Routine - Unscheduled | Low Risk | Improper food storage |
| 4 | Routine - Unscheduled | Low Risk | Unapproved or unmaintained equipment or utensils |
2.1.3.1. Ordinal Features#
Ordinal data is data that is ordered in some way. For example, the size of a t-shirt is ordinal data. The sizes are ordered from smallest to largest. The sizes are more or less than each other. They are different and ordered.
Show code cell source
data[['risk']].head()
| risk | |
|---|---|
| 0 | High Risk |
| 1 | NaN |
| 2 | Low Risk |
| 3 | Low Risk |
| 4 | Low Risk |
2.1.3.1.1. Encoding Ordinal Features#
Ordinal features can be encoded using a technique called label encoding. Label encoding is simply converting each value in a column to a number. For example, the sizes of t-shirts could be represented as 0 (XS), 1 (S), 2 (M), 3 (L), 4 (XL), 5 (XXL).
data['risk_enc'] = data['risk'].replace({'Low Risk': 0, 'Moderate Risk': 1, 'High Risk': 2})
data.head()
| id | zip | phone | lat | lng | type | score | risk | violation | risk_enc | |
|---|---|---|---|---|---|---|---|---|---|---|
| 0 | 64454 | 94105 | NaN | 37.787925 | -122.400953 | Routine - Unscheduled | 82.0 | High Risk | High risk food holding temperature | 2.0 |
| 1 | 33014 | 94109 | NaN | 37.786108 | -122.425764 | Complaint | NaN | NaN | NaN | NaN |
| 2 | 1526 | 94115 | NaN | 37.791607 | -122.434563 | Routine - Unscheduled | 82.0 | Low Risk | Inadequate warewashing facilities or equipment | 0.0 |
| 3 | 73 | 94115 | NaN | 37.788932 | -122.433895 | Routine - Unscheduled | 78.0 | Low Risk | Improper food storage | 0.0 |
| 4 | 66402 | 94110 | NaN | 37.739161 | -122.416967 | Routine - Unscheduled | 94.0 | Low Risk | Unapproved or unmaintained equipment or utensils | 0.0 |
2.1.3.2. Nominal Features#
Nominal data is data that is not ordered in any way. For example, the color of a car is nominal data. There is no order to the colors. The colors are not more or less than each other. They are just different.
data[['type', 'violation']].head()
| type | violation | |
|---|---|---|
| 0 | Routine - Unscheduled | High risk food holding temperature |
| 1 | Complaint | NaN |
| 2 | Routine - Unscheduled | Inadequate warewashing facilities or equipment |
| 3 | Routine - Unscheduled | Improper food storage |
| 4 | Routine - Unscheduled | Unapproved or unmaintained equipment or utensils |
2.1.3.2.1. Encoding Nominal Features#
Since nominal features don’t have any order, encoding them requires some creativity. The most common way to encode nominal features is to use a technique called one-hot encoding. One-hot encoding creates a new column for each unique value in the nominal feature. Each new column is a binary feature that indicates whether or not the original observation had that value.
The figure below illustrates how one-hot encoding for a “day” (of the week) column:
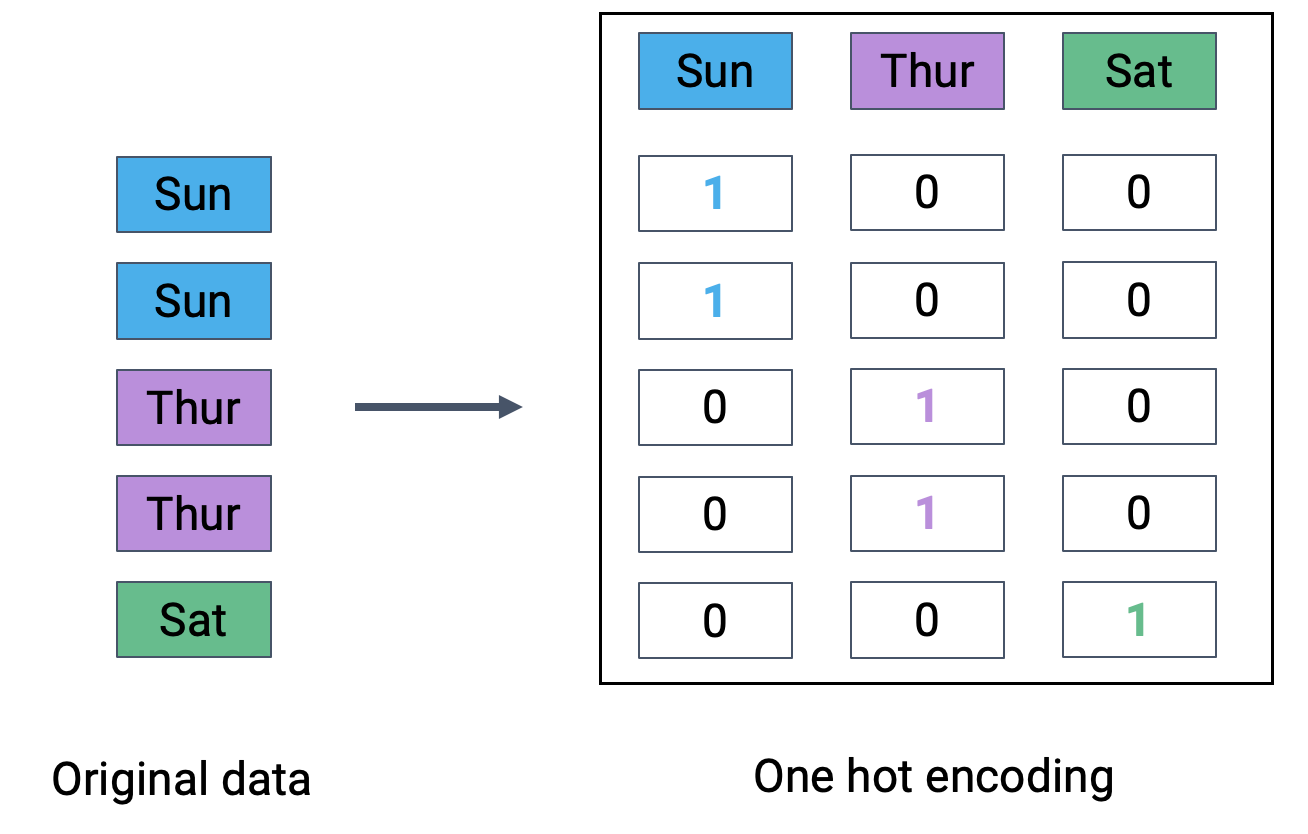
Fig. 2.3 One-hot encoding#
pandas has a built-in .get_dummies function for doing this:
pd.get_dummies(data['type']).head()
| Complaint | New Construction | New Ownership | Reinspection/Followup | Routine - Unscheduled | |
|---|---|---|---|---|---|
| 0 | 0 | 0 | 0 | 0 | 1 |
| 1 | 0 | 0 | 0 | 0 | 1 |
| 2 | 1 | 0 | 0 | 0 | 0 |
| 3 | 0 | 0 | 0 | 0 | 1 |
| 4 | 0 | 0 | 0 | 0 | 1 |