1.3. Pandas III: Selection, Filtering and Dropping#
In this section, we will learn how to extract and remove a subset of rows and columns in pandas. The two primary operations of data extraction are:
Selection: Extracting subset of columns.
Filtering: Extracting subset of rows.
Let’s start by loading the dataset.
import pandas as pd

url = "https://raw.githubusercontent.com/fahadsultan/csc272/main/data/elections.csv"

elections = pd.read_csv(url)
1.3.1. Selection: subset of columns#
To select a column in a DataFrame, we can use the bracket notation. That is, name of the DataFrame followed by the column name in square brackets: df['column_name'].

Fig. 1.22 To select a column, we can use the bracket notation: df['column_name']. This extracts a single column as a Series.#
To select multiple columns, we can pass a list of column names: df[['column_name1', 'column_name2']]. This extracts multiple columns as a DataFrame.
For example, to select a column named Candidate from the election DataFrame, we can use the following code:
candidates = elections['Candidate']
print(candidates)
0         Andrew Jackson
1      John Quincy Adams
2         Andrew Jackson
3      John Quincy Adams
4         Andrew Jackson
             ...
177           Jill Stein
178         Joseph Biden
179         Donald Trump
180         Jo Jorgensen
181       Howard Hawkins
Name: Candidate, Length: 182, dtype: object
This extracts a single column as a Series. We can confirm this by checking the type of the output.
type(candidates)
pandas.core.series.Series
To select multiple columns, we can pass a list of column names. For example, to select both Candidate and Votes columns from the election DataFrame, we can use the following line of code:
elections[['Candidate', 'Party']]
| Candidate | Party | |
|---|---|---|
| 0 | Andrew Jackson | Democratic-Republican |
| 1 | John Quincy Adams | Democratic-Republican |
| 2 | Andrew Jackson | Democratic |
| 3 | John Quincy Adams | National Republican |
| 4 | Andrew Jackson | Democratic |
| ... | ... | ... |
| 177 | Jill Stein | Green |
| 178 | Joseph Biden | Democratic |
| 179 | Donald Trump | Republican |
| 180 | Jo Jorgensen | Libertarian |
| 181 | Howard Hawkins | Green |
182 rows × 2 columns
This extracts multiple columns as a DataFrame. We can confirm as well this by checking the type of the output.
type(elections[['Candidate', 'Party']])
This is how we can select columns in a DataFrame. Next, let’s learn how to filter rows.
1.3.2. A Filtering Condition#
Perhaps the most interesting (and useful) method of selecting data from a Series is with a filtering condition.
First, we apply a boolean condition to the Series. This create a new Series of boolean values.
series = pd.Series({'a': 1, 'b': 2, 'c': 3, 'd': 4})
series > 2
a    False
b    False
c     True
d     True
dtype: bool

We then use this boolean condition to index into our original Series. pandas will select only the entries in the original Series that satisfy the condition.
series[series > 2]
c    3
d    4
dtype: int64
1.3.3. Filtering: subset of rows#
Extracting a subset of rows from a DataFrame is called filtering.
We can filter rows based on a boolean condition, similar to conditional statements (e.g., if, else) in Python.

Fig. 1.23 To filter rows based on a boolean condition, we can use the bracket notation: df[boolean_condition]. This extracts rows where the condition is True.#
To filter rows based on multiple conditions, we can use the & operator for AND and the | operator for OR.
For example, to filter rows of candidates who ran for elections since 2010, we can use the following code:
condition = election['Year'] > 2010

election[condition]
| Year | Candidate | Party | Popular vote | Result | % | |
|---|---|---|---|---|---|---|
| 168 | 2012 | Barack Obama | Democratic | 65915795 | win | 51.258484 |
| 169 | 2012 | Gary Johnson | Libertarian | 1275971 | loss | 0.992241 |
| 170 | 2012 | Jill Stein | Green | 469627 | loss | 0.365199 |
| 171 | 2012 | Mitt Romney | Republican | 60933504 | loss | 47.384076 |
| 172 | 2016 | Darrell Castle | Constitution | 203091 | loss | 0.149640 |
| 173 | 2016 | Donald Trump | Republican | 62984828 | win | 46.407862 |
| 174 | 2016 | Evan McMullin | Independent | 732273 | loss | 0.539546 |
| 175 | 2016 | Gary Johnson | Libertarian | 4489235 | loss | 3.307714 |
| 176 | 2016 | Hillary Clinton | Democratic | 65853514 | loss | 48.521539 |
| 177 | 2016 | Jill Stein | Green | 1457226 | loss | 1.073699 |
| 178 | 2020 | Joseph Biden | Democratic | 81268924 | win | 51.311515 |
| 179 | 2020 | Donald Trump | Republican | 74216154 | loss | 46.858542 |
| 180 | 2020 | Jo Jorgensen | Libertarian | 1865724 | loss | 1.177979 |
| 181 | 2020 | Howard Hawkins | Green | 405035 | loss | 0.255731 |
To filter rows based on multiple conditions, we can use the & operator for AND and the | operator for OR.
For example, to filter rows of candidates who won the elections with less than 50% of the votes, we can use the following code:
condition = (election['Result'] == 'win') & (election['%'] < 50)

election[condition]
| Year | Candidate | Party | Popular vote | Result | % | |
|---|---|---|---|---|---|---|
| 1 | 1824 | John Quincy Adams | Democratic-Republican | 113142 | win | 42.789878 |
| 16 | 1848 | Zachary Taylor | Whig | 1360235 | win | 47.309296 |
| 20 | 1856 | James Buchanan | Democratic | 1835140 | win | 45.306080 |
| 23 | 1860 | Abraham Lincoln | Republican | 1855993 | win | 39.699408 |
| 33 | 1876 | Rutherford Hayes | Republican | 4034142 | win | 48.471624 |
| 36 | 1880 | James Garfield | Republican | 4453337 | win | 48.369234 |
| 39 | 1884 | Grover Cleveland | Democratic | 4914482 | win | 48.884933 |
| 43 | 1888 | Benjamin Harrison | Republican | 5443633 | win | 47.858041 |
| 47 | 1892 | Grover Cleveland | Democratic | 5553898 | win | 46.121393 |
| 70 | 1912 | Woodrow Wilson | Democratic | 6296284 | win | 41.933422 |
| 74 | 1916 | Woodrow Wilson | Democratic | 9126868 | win | 49.367987 |
| 100 | 1948 | Harry Truman | Democratic | 24179347 | win | 49.601536 |
| 117 | 1968 | Richard Nixon | Republican | 31783783 | win | 43.565246 |
| 140 | 1992 | Bill Clinton | Democratic | 44909806 | win | 43.118485 |
| 144 | 1996 | Bill Clinton | Democratic | 47400125 | win | 49.296938 |
| 152 | 2000 | George W. Bush | Republican | 50456002 | win | 47.974666 |
| 173 | 2016 | Donald Trump | Republican | 62984828 | win | 46.407862 |
1.3.4. Extracting subset of values#
To extract a subset of values, we can use .loc[] or .iloc[] with row and column indices and labels respectively.

The .loc[] method is used to access a group of rows and columns by labels or a boolean array.
1.3.4.1. .loc[row_labels, col_labels]#
The .loc operator selects rows and columns in a DataFrame by their row and column label(s), respectively. The row labels (commonly referred to as the indices) are the bold text on the far left of a DataFrame, while the column labels are the column names found at the top of a DataFrame.
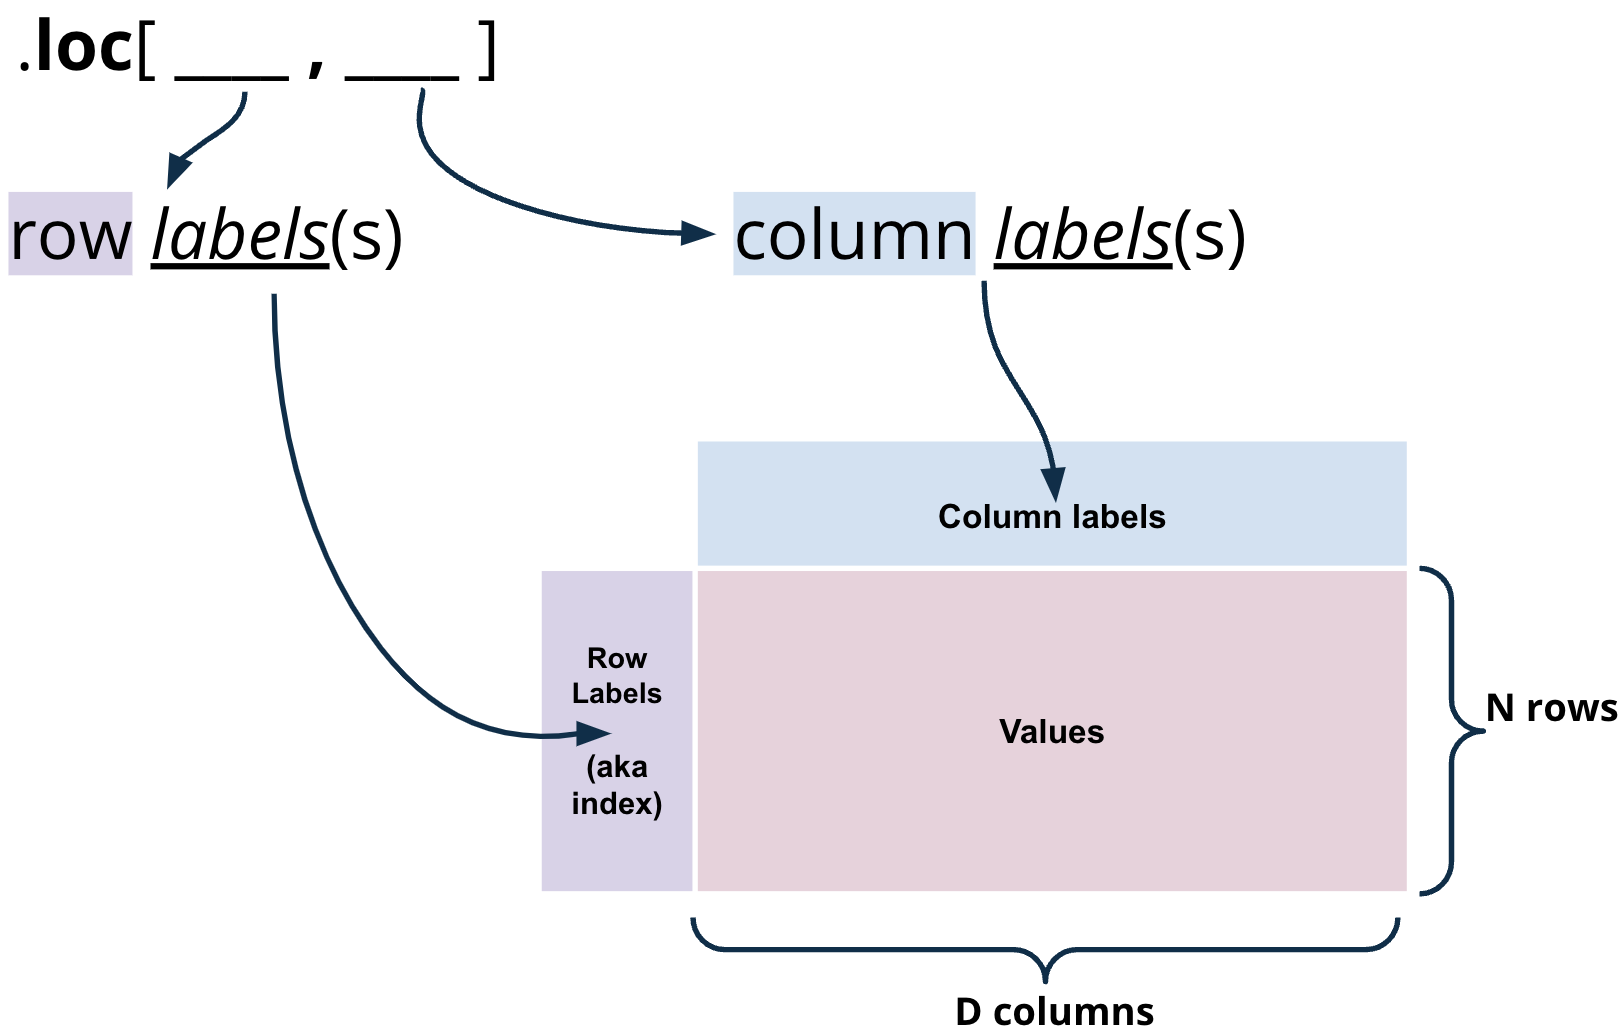
Fig. 1.24 .loc[i, j] returns value(s) where row label(s)== i and column label(s)== j in the DataFrame.#
To grab data with .loc, we must specify the row and column label(s) where the data exists. The row labels are the first argument to the .loc function; the column labels are the second. For example, we can select the the row labeled 0 and the column labeled Candidate from the elections DataFrame.
elections.loc[0, 'Candidate']
To select multiple rows and columns, we can use Python slice notation. Here, we select the rows from labels 0 to 3 and the columns from labels "Year" to "Popular vote".
elections.loc[0:3, 'Year':'Popular vote']
Suppose that instead, we wanted every column value for the first four rows in the elections DataFrame. The shorthand : is useful for this.
elections.loc[0:3, :]
There are a couple of things we should note. Firstly, unlike conventional Python, Pandas allows us to slice string values (in our example, the column labels). Secondly, slicing with .loc is inclusive. Notice how our resulting DataFrame includes every row and column between and including the slice labels we specified.
Equivalently, we can use a list to obtain multiple rows and columns in our elections DataFrame.
elections.loc[[0, 1, 2, 3], [‘Year’, ‘Candidate’, ‘Party’, ‘Popular vote’]]
Lastly, we can interchange list and slicing notation. elections.loc[[0, 1, 2, 3], :]
1.3.4.2. .iloc[row_indices, col_indices]#
The .iloc[] method is used to access a group of rows and columns by integer position.
Warning
If you find yourself needing to use .iloc then stop and think if you are about to implement a loop. If so, there is probably a better way to do it.
Slicing with .iloc works similarily to .loc, however, .iloc uses the index positions of rows and columns rather the labels (think to yourself: loc uses labels; iloc uses indices). The arguments to the .iloc function also behave similarly -– single values, lists, indices, and any combination of these are permitted.
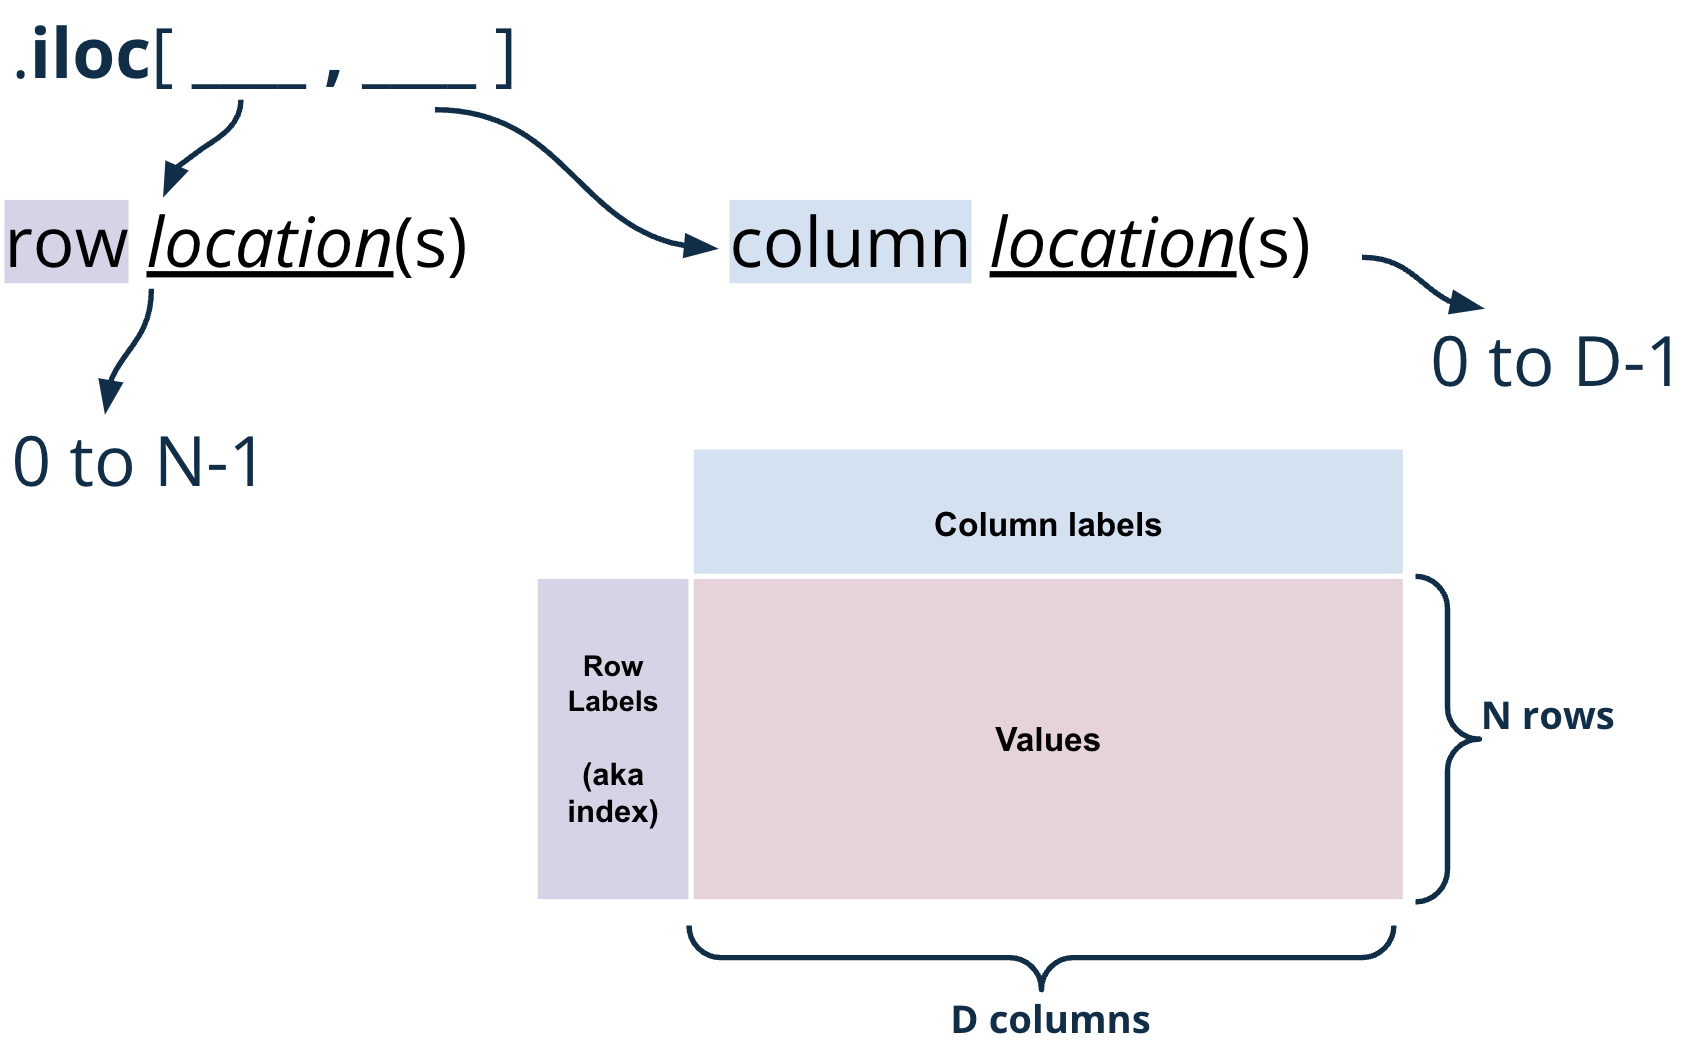
Fig. 1.25 .iloc[i, j] returns value(s) where row location(s)== i and column location(s)== j in the DataFrame.#
Let’s begin reproducing our results from above. We’ll begin by selecting for the first presidential candidate in our elections DataFrame:
# elections.loc[0, "Candidate"] - Previous approach
elections.iloc[0, 1]
Notice how the first argument to both .loc and .iloc are the same. This is because the row with a label of 0 is conveniently in the 0th index (equivalently, the first position) of the elections DataFrame. Generally, this is true of any DataFrame where the row labels are incremented in ascending order from 0.
However, when we select the first four rows and columns using .iloc, we notice something.
# elections.loc[0:3, 'Year':'Popular vote'] - Previous approach
elections.iloc[0:4, 0:4]
Slicing is no longer inclusive in .iloc -– it’s exclusive. In other words, the right-end of a slice is not included when using .iloc. This is one of the subtleties of pandas syntax; you will get used to it with practice.
#elections.loc[[0, 1, 2, 3], ['Year', 'Candidate', 'Party', 'Popular vote']] - Previous Approach
elections.iloc[[0, 1, 2, 3], [0, 1, 2, 3]]
This discussion begs the question: when should we use .loc vs .iloc? In most cases, .loc is generally safer to use. You can imagine .iloc may return incorrect values when applied to a dataset where the ordering of data can change.
1.3.4.3. []#
The [] selection operator is the most baffling of all, yet the most commonly used. It only takes a single argument, which may be one of the following:
A slice of row numbers
A list of column labels
A single column label
That is, [] is context dependent. Let’s see some examples.
Say we wanted the first four rows of our elections DataFrame.
elections[0:4]
| Year | Candidate | Party | Popular vote | Result | % | |
|---|---|---|---|---|---|---|
| 0 | 1824 | Andrew Jackson | Democratic-Republican | 151271 | loss | 57.210122 |
| 1 | 1824 | John Quincy Adams | Democratic-Republican | 113142 | win | 42.789878 |
| 2 | 1828 | Andrew Jackson | Democratic | 642806 | win | 56.203927 |
| 3 | 1828 | John Quincy Adams | National Republican | 500897 | loss | 43.796073 |
1.3.5. Dropping rows and columns#
To drop rows and columns in a DataFrame, we can use the drop() method.
For example, to drop the first row from the election DataFrame, we can use the following code:
elections.head()
| Year | Candidate | Party | Popular vote | Result | % | |
|---|---|---|---|---|---|---|
| 0 | 1824 | Andrew Jackson | Democratic-Republican | 151271 | loss | 57.210122 |
| 1 | 1824 | John Quincy Adams | Democratic-Republican | 113142 | win | 42.789878 |
| 2 | 1828 | Andrew Jackson | Democratic | 642806 | win | 56.203927 |
| 3 | 1828 | John Quincy Adams | National Republican | 500897 | loss | 43.796073 |
| 4 | 1832 | Andrew Jackson | Democratic | 702735 | win | 54.574789 |
elections.drop(columns=['Popular vote'])
| Year | Candidate | Party | Result | % | |
|---|---|---|---|---|---|
| 0 | 1824 | Andrew Jackson | Democratic-Republican | loss | 57.210122 |
| 1 | 1824 | John Quincy Adams | Democratic-Republican | win | 42.789878 |
| 2 | 1828 | Andrew Jackson | Democratic | win | 56.203927 |
| 3 | 1828 | John Quincy Adams | National Republican | loss | 43.796073 |
| 4 | 1832 | Andrew Jackson | Democratic | win | 54.574789 |
| ... | ... | ... | ... | ... | ... |
| 177 | 2016 | Jill Stein | Green | loss | 1.073699 |
| 178 | 2020 | Joseph Biden | Democratic | win | 51.311515 |
| 179 | 2020 | Donald Trump | Republican | loss | 46.858542 |
| 180 | 2020 | Jo Jorgensen | Libertarian | loss | 1.177979 |
| 181 | 2020 | Howard Hawkins | Green | loss | 0.255731 |
182 rows × 5 columns
# Drop the first row
elections.drop(index=0)

# Drop the first two rows
elections.drop(index=[0, 1])
| Year | Candidate | Party | Popular vote | Result | % | |
|---|---|---|---|---|---|---|
| 2 | 1828 | Andrew Jackson | Democratic | 642806 | win | 56.203927 |
| 3 | 1828 | John Quincy Adams | National Republican | 500897 | loss | 43.796073 |
| 4 | 1832 | Andrew Jackson | Democratic | 702735 | win | 54.574789 |
| 5 | 1832 | Henry Clay | National Republican | 484205 | loss | 37.603628 |
| 6 | 1832 | William Wirt | Anti-Masonic | 100715 | loss | 7.821583 |
| ... | ... | ... | ... | ... | ... | ... |
| 177 | 2016 | Jill Stein | Green | 1457226 | loss | 1.073699 |
| 178 | 2020 | Joseph Biden | Democratic | 81268924 | win | 51.311515 |
| 179 | 2020 | Donald Trump | Republican | 74216154 | loss | 46.858542 |
| 180 | 2020 | Jo Jorgensen | Libertarian | 1865724 | loss | 1.177979 |
| 181 | 2020 | Howard Hawkins | Green | 405035 | loss | 0.255731 |
180 rows × 6 columns